GenAI Forecasts 2030: Why Analysts Are 8x Apart
Bloomberg sees $2.3T. Mordor sees $127B. The same market, the same year — here's why every generative AI forecast through 2030 is fighting a different war.
By Abhijit
Home
Bloomberg sees $2.3T. Mordor sees $127B. The same market, the same year — here's why every generative AI forecast through 2030 is fighting a different war.
By Abhijit
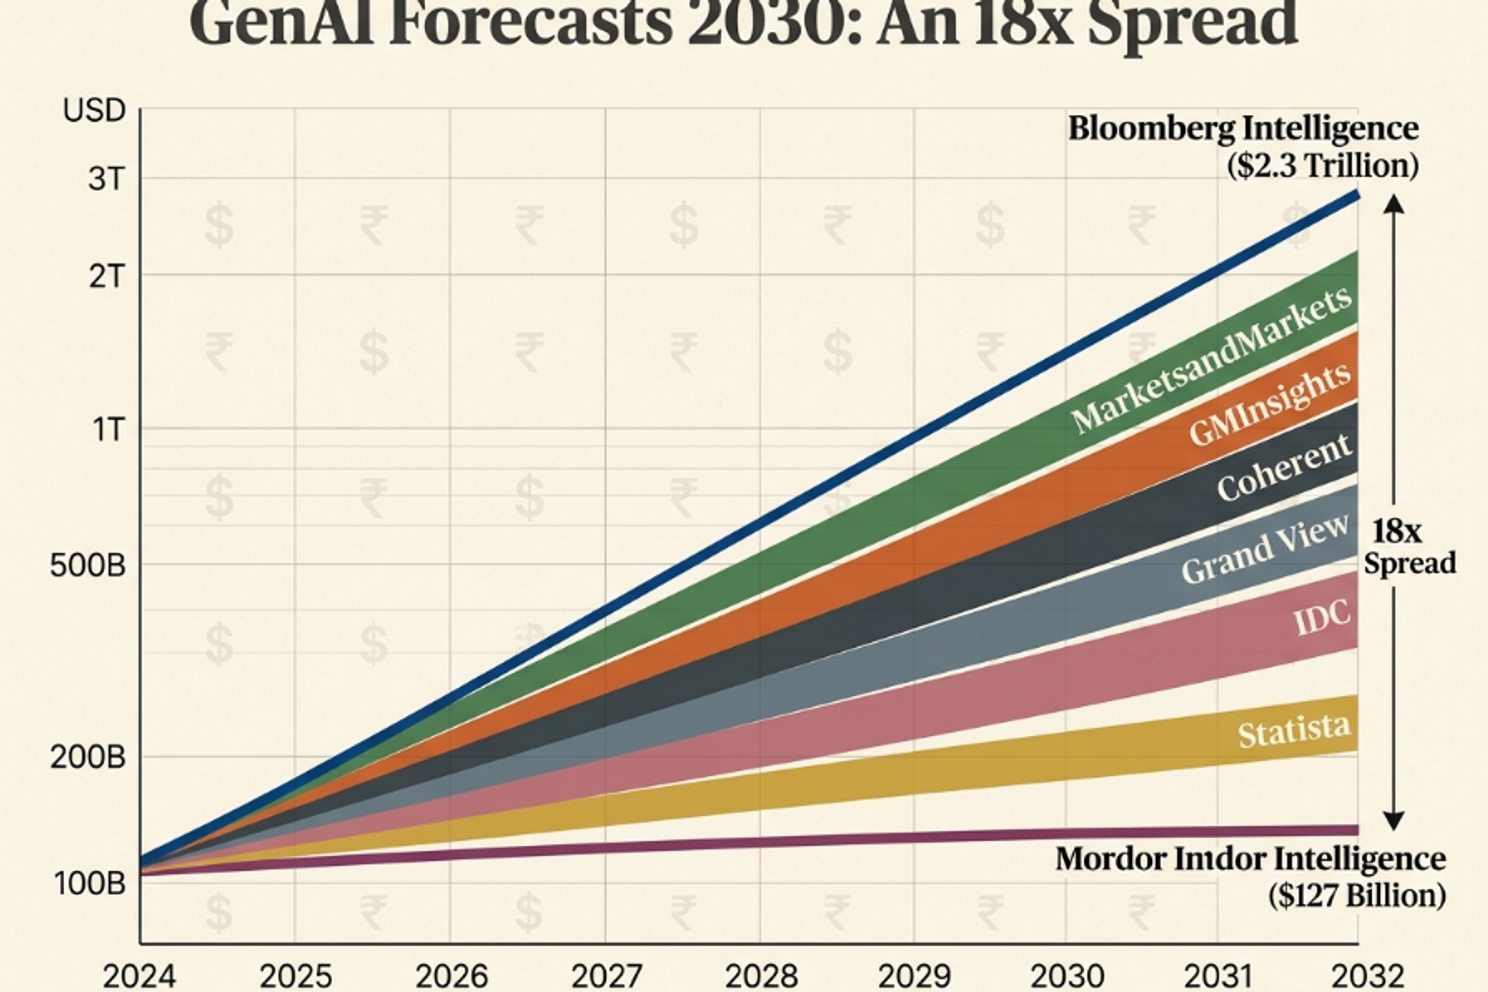
Eight major analysts publish generative AI forecasts through 2030. They disagree by a factor of eight on a market they're all describing — because they're not actually measuring the same thing. Bloomberg Intelligence updated its headline number to $2.3T by 2032 in a June 2026 press item. Mordor Intelligence still projects $126.66B by 2031. Both are defensible — and the gap between them is the most useful map of how this category is actually monetizing.
The headline confusion is not noise. It's a methodology fight with a $2 trillion price tag, and getting on the wrong side of it costs founders their pitch decks, CFOs their budgets, and investors their thesis.
Strip the marketing language out of every published 2030 forecast and the range looks like this:
That 18x spread between Mordor and Bloomberg cannot be reconciled by rounding or recency. It exists because each firm draws the market boundary somewhere different, and most readers never check where.
Forrester sharpens the picture with a single growth-rate anchor: generative AI spend will grow ~36% annually through 2030, a figure they apply to enterprise spend specifically rather than vendor revenue. PwC and Accenture publish GDP-impact frameworks (PwC's long-running ~$15.7T AI-to-GDP-by-2030 figure) that count economic value, not software sold. None of these are wrong. They're stacked.
The GenAI Forecast Stack: A three-layer model that explains forecast divergence by separating software revenue (what vendors invoice), enterprise spend (what buyers expense), and orchestrated GMV (what transactions AI mediates). Every credible 2030 number maps cleanly to one of these three layers.
Layer 1 — Software revenue: $100B–$300B by 2030 territory. This is what Grand View, Mordor, and Fortune Business Insights typically measure. It counts subscriptions, API calls, and licensed models. Anthropic's reported $30B+ run-rate revenue in April 2026 lives here.
Layer 2 — Enterprise spend: $400B–$2.3T by 2030 territory. This is the Gartner/IDC/Bloomberg zone. It bundles software with the infrastructure, services, and labor required to deploy it. Gartner's worldwide AI spending forecast for 2026 alone hit $2.59T (+47% YoY) — most of that is infrastructure, not GenAI software.
Layer 3 — Orchestrated GMV: $3T–$5T by 2030 territory. This is McKinsey's, Bain's, and Morgan Stanley's framing for agentic commerce. It measures the value of transactions an AI agent touches, not vendor revenue. Bain's $300B–$500B US agentic-commerce projection sits here; McKinsey's $3T–$5T global B2C number sits at the top of the same layer.
A founder pitching a $890B TAM should know which layer they're standing on. A CFO writing a 2027 AI budget needs to know which layer the consultant's slide is drawn from. That's the share trigger and the actual analytical payoff of this entire category.
Three real growth vectors push every layer of the stack upward simultaneously in 2026.
Hyperscaler capex. McKinsey estimates global AI-powered data center capex hits ~$7T by 2030. The four biggest hyperscalers committed $650B in 2026 alone, up 71.1% year-over-year. This is what makes Bloomberg's enterprise-spend numbers move.
Code generation revenue velocity. Cursor went from $100M ARR (2024) to $1B (Nov 2025) to $2B (Feb 2026) — the fastest SaaS ramp from $1M to $1B in history. Anthropic's coding share, per Menlo Ventures' portfolio data, hit ~54% of AI coding spend by mid-2026, up from 42% six months earlier. GitHub Copilot carries the volume (26M+ users, 4.7M paid, 90% Fortune 100 penetration) while Cursor and Claude Code split developer mindshare (~18% workplace adoption each per JetBrains' January 2026 survey).
Agentic embedding. Gartner: 40% of enterprise applications will embed task-specific AI agents by end of 2026, up from under 5% in 2025. This is where the GenAI line dissolves into the agentic line and confuses every standalone forecast.
The most common framing error in 2026 is treating "agentic AI market size" as a single number. There are two numbers, separated by ~20x.
Standalone agentic AI software: $7–10.8B in 2026, per Deloitte ($8.5B), Fortune Business Insights ($9.14B), and Market.us ($10.8B). Growing 40–44% CAGR but on a small base.
Embedded agent spend: $201.9B in 2026 per Gartner — counting agentic features baked into existing enterprise applications. By 2027, Gartner expects this to overtake chatbot spending entirely.
The contrarian read: by 2027, the line between "generative" and "agentic" stops being a market category and becomes a feature toggle. Forecasters who keep them separate after 2027 are measuring marketing copy, not architecture.
The same divergence plays out at the vertical level, with the gap widening in sectors where AI touches transactions rather than just workflows.
Generative AI in healthcare: $10–15B by 2030 across most firms (Grand View $14.77B; Research and Markets $11.6B by 2029; Towards Healthcare projects $53.68B by 2035 on a longer horizon). Microsoft-IDC's $3.20-per-$1 ROI within 14 months is widely cited — but it's a vendor-adjacent number, and clinical adoption lags FDA/EMA validation timelines that no forecast accounts for cleanly. Drug discovery (42.91% CAGR through 2031) and robot-assisted surgery (39.1% CAGR) are the only sub-segments where the curve and the regulatory clock align.
Software-pure GenAI in BFSI: $7.7–$16B by 2030 (Fortune Business Insights $13.57B by 2032; Grand View $16.02B). Total banking GenAI spend: $84.99B by 2030 at 55.55% CAGR per Juniper/Statista — a 1,400% growth path. Fraud detection alone is projected to be 35% of spend (~$3B), with cloud-based deployment taking 78% ($6B). The takeaway: when you read "$85B banking GenAI market," confirm whether the analyst is counting software invoices or the total spend banks book against AI initiatives. The two numbers differ by 5x in the same year.
GenAI in e-commerce software: ~$1.1B in 2026 → $3.95B by 2035 per Precedence Research. Agentic commerce GMV: $190B–$385B US (Morgan Stanley) to $3T–$5T global (McKinsey) by 2030. These are not the same market. GMV numbers measure influenced transaction value, not vendor revenue, and 30–45% of US consumers are already using generative AI for product research per Salesforce. Cite the $5T figure to a CFO and you'll lose the room — cite it to a board pitching a retail-agent thesis and it's the entire argument.
Ad-tech monetization (creative automation, personalized video, programmatic targeting) is the second-fastest application segment after code generation, but rarely broken out cleanly in published forecasts. Publisher-side GMV (AI-influenced ad inventory) and vendor-side revenue (creative tools, ad-personalization APIs) need to be split the same way retail does — most analyst reports collapse them and inflate the headline.
Document review, contract automation, and e-discovery dominate. Forrester and IDC track the segment but rarely as a standalone forecast line; private vendor signals (Harvey, Ironclad, Spellbook) suggest 35–45% CAGR on a base small enough that even a $20B 2030 forecast would surprise most analysts.
Every credible methodology section in this category reduces to seven choices. Get one wrong and your headline number moves by 30–300%.
That seventh lever is the one most analysts and almost every blog post quietly skip. Token prices have collapsed ~80% since 2023 on equivalent capability — a forecast that didn't model this is already wrong, and one that overcorrects for it underestimates the market.
A worked example: take any "software" GenAI number for 2030 and add roughly 3–4x for infrastructure-inclusive enterprise spend, then 8–10x again for GMV-inclusive agentic commerce. That math gets you from Mordor to McKinsey without anyone being wrong.
The 2025 vendor map per GMInsights: OpenAI 23.6%, followed by Anthropic, NVIDIA, Adobe, and Microsoft — collectively 58.1% of revenue. By June 2026, Anthropic's valuation overtook OpenAI's ($965B post-Series H vs. OpenAI's ~$730B), and Anthropic's run-rate revenue crossed $47B per Crunchbase.
Two caveats. First, vendor-share slides routinely undercount open-source deployments (Llama, Mistral, DeepSeek) and regional vendors (Alibaba's Qwen, Baidu's ERNIE), where revenue capture is harder to measure but workload share is not trivial. Second, hyperscaler-startup M&A activity in H1 2026 is compressing the vendor count further — expect the top-5 share to push past 65% by 2027.
The Scaling Gap: The structural distance between AI proof-of-concept activity and production deployment. IDC measures it at 88% of POCs failing to reach widescale deployment — the single largest delta between headline growth forecasts and realized vendor revenue.
Gartner expects more than 40% of agentic AI projects to be canceled outright by 2027. Only 23% of organizations report significant ROI from AI agents, versus 29% from generative AI overall. Data privacy and security remain the cited top risk for 76% of enterprises.
The honest reading of every 2030 forecast: the upper-bound numbers assume the scaling gap closes. It hasn't yet. Forrester's 2026 "hard hat" stance — counsel buyers to budget for the gap, not the curve — is the only analyst posture that matches the deployment data.
The Gridpulse Brief — Every Sunday, we decode the AI market noise into the 3–5 stories that actually move budgets, valuations, and your portfolio. No press-release recycling. → Subscribe here
The next 18 months will resolve three open questions in this market. Whether Anthropic's IPO (filed June 1, 2026) and OpenAI's expected H2 2026 listing price the public market closer to Bloomberg's $2.3T frame or to Mordor's $127B floor. Whether agentic embedding actually dissolves the GenAI/agentic line by 2027 or fragments into a second standalone category. And whether the scaling gap closes enough to let upper-bound forecasts survive their first reality check.
Bet on the layer of the stack you're actually selling into — and discount every forecast that doesn't tell you which layer it measured.

Early research on AI and cognition suggests offloading to chatbots can weaken recall, persistence, and problem-solving. One MIT study found essay writers using gen AI performed worse over time.

Xbox loses 64 cents on every dollar and just cut 3,200 jobs. Here's why even the biggest game launch in history can't fix gaming's broken economics.

Google's Gemini Omni Flash generates and edits video in conversation at $0.10/second. Here's what the API actually delivers — and where 720p hits a wall.
Z.ai shipped GLM-5.2 with a 1M-token context window and zero benchmarks. Here's what's confirmed, what's hype, and whether to switch today.

Anthropic's 11 Cowork plugins erased a real margin pool overnight. The mechanism, the casualty list, and what it does to Indian IT services next.

Two free skills, one reference folder, and the exact prompts I used to ship a $10K-tier animated portfolio in Claude Code. No agency, no boilerplate.
Get weekly curations of the best articles, resources, and insights directly to your inbox about AI, Tech, Finance & Business.